The geometric mean (6.9) is all that really matters for investors, not the arithmetic mean (8.4) - the arithmetic mean under-weights the importance of negative years to long term performance.
For example, if the market is down 20% one year and up 20% the next year, the arithmetic mean will be 0%, but you'll be down 4% (0.8*1.2 = 0.96), which is reflected in the geometric mean of (about) -2%.
Depends, dollar cost averaging shifts things around. For a typical 401k style investor having down years mid career improves returns at retirement, but then increases risks in retirement.
The “average” investor gets paid cash and not in stock.
The public tech company employee has less to invest because a large portion of their income is in stock.
The private tech company employee is screwed because statistically, they have equity that won’t amount to shit in a bull market let alone a bear market.
The "average" investor is in jobs less hit by typical recession/down market impacts, since the odds of a hospitality worker or barista having a retirement account in the first place is much lower than the odds of a white collar employee.
The point of comparison would be average reduction in investment vs average reduction in stock price. It’s true people invest less, but stocks take much larger drops than the reduction in the workforce.
Are you arguing that the stock market is not correlated with unemployment? That’s a weird and plain stupid hill to die on because anybody can disprove it with 3 seconds of googling.
It might be a stupid hill to die on that general statement, but currently we have a falling stock market with very little unemployment which is part of the reason for the inflation.
> An inverse relationship between level of unemployment and forward stock market returns. In the current quintile (2.5% to 4.4% unemployment), the average S&P 500 return over the following year is 5.6% versus and average of 12.7% in all periods. The best returns historically have come after periods of high unemployment
Maybe you should use a source that is at least self consistent?
Inverse relationship between unemployment and returns - proceeds to show a table where the lowest quintiles of unemployment have the lowest returns. That doesn’t seem very inverse to me.
In any case even if you don’t use some trash site that can’t get a basic editor/proofreader and correct that error, it’s not counter to anything already told to you by me and others.
You both make valid points. The JPMorgan memo's point is that a view on the economy is insufficient for reaching a view on the market. If we're heading into a recession, that doesn't necessarily mean stocks will fall. If we've rounded the bottom, it doesn't mean stocks will rise. More pointedly, it's asking its clients not to sell even while it predicts a recession.
The Seeking Alpha piece doesn't support your argument. Returns one year post peak unemployment are good because valuations at peak unemployment are in their trough. The correlation drives the effect. The article could be summed up as buy when the market is low / unemployment is high.
There is a real effect that comes from the stock market being forward looking and the labor market backwards [1]. When unemployment goes up, markets go down, and that's a problem for forced sellers.
> An inverse relationship between level of unemployment and forward stock market returns. In the current quintile (2.5% to 4.4% unemployment), the average S&P 500 return over the following year is 5.6% versus and average of 12.7% in all periods. The best returns historically have come after periods of high unemployment
Of course they don’t, that’s not what your articles say. Did you read them? They, respectively, say that the market is forward-looking and that major gains are made after downturns.
It can simultaneously be true that major gains are made after downturns and that there has historically been a strong correlation between downturns and unemployment.
And even these days the typical investor probably uses a financial advisor, who would do such fund reallocation, even if they don't use target date funds explicitly (which they should).
Do they really? When I've looked around at financial advisors they've wanted at least several percent annually of AUM, which, to my mind, is just insane.
For this hypothetical, I don't think it makes sense to consider anything but a typical 401k investor that only invests in the sp500. Thats all that we're tracking here.
When spending down money you get the reverse of cost dollar averaging. In a good year you might sell say 1,000 shares but in a down year you might need to sell twice that to take out the same money. This means more of your shares are sold in down years than good years.
This is why people say to increase the bond ratio in retirement, but that also reduces expected returns.
I'll just share this. I've recorded every retirement contribution and date since I started saving for retirement back in the late 90's. From that, I can figure APY at any time by comparing to my balance.
I had some learning experiences early on but never totally lost my shirt. I went through the dotcom crash, the finsys crash, and the more recent stuff. And I've been following Bogle philosophy for a very long time, of an allocation model with a percentage in US stocks, intl stocks, bonds, and cash.
I would love to have 3.5% real over that time period.
Now, it's possible I'm the world's lousiest investor, but I don't think so. Because I did a similar exercise pretending "what if I had just bought S&P500 on those dates?" and looked at dividend-adjusted-close. And the results there were also nowhere near as high as you'd expect.
People just can't equate "stock market performance" with what their own performance will be. You might get laid off when economy is bad and markets are down. You might have more money to invest at the top of the market, and less at the bottom, which totally screws up dollar-cost-averaging. You won't be entirely in the stock market, keeping some in bonds in cash. Your "well, I'm getting old so I should keep less in the market" decision might align with the beginning of one of the most irrational bull markets in history. (All of the above have been true for me.)
I think the only real answers are just to save like crazy, keep expenses low, and push for a better social safety net. My own retirement projections assume Social Security will only pay out at 74%, and I'm feeling the need to have a big buffer due to economic/political uncertainty, which really sucks.
I have been a Betterment customer since 2014 - robo-advisor-driven portfolio since the start of my retirement journey.
Been 90% stocks/10% bonds the whole time, though the underlying basket has shifted a few times as I made decisions about how to skew the basket using Betterment's portfolio options.
8 years on, I have a total annualized return of 4.9%, with Betterment saying "All performance figures displayed reflect the actual performance of your account since its creation in terms of total time-weighted returns, net of Betterment's management fee, fund fees, and certain other fees, if applicable."
The most volatile part of my retirement journey has been how much money I am able to contribute in a given month; some of these years I've had the job security and consistent income to dollar cost average the whole year's worth of contributions every 2 weeks or every month; other years I've had to wait until some amount of money became available to do a more "lump sum" contribution.
Thank you for your comment as far as it can at least help me set expectations for how I might see this performance number continue to go up and down over time!
First, please repeat the standard mantra: past performance is no guarantee of future success.
Then tell me the 95th percentile and the median geometric returns based of fixed periods (say, copy the 20 years.)
Let us also grab what an inflation linked gov bond would have given over those same periods. Classically I would always think of pension returns as vs the risk free rate (heh, us gov credit risk) which is essentially an IL bond.
Then repeat the analysis on, say, the G8 or G20 countries. Oh, and lets do a variety of stock indexes as well. I am a great believer in diversification - so betting on the US is not my standard behaviour.
6.9% assumed return is mad for any individual. It would be mad for a DB scheme _and they at least have some risk pooling in their favour_.
But. I am hella risk averse and see the world through that lens.
Yep, long-term I'm okay at 3%, comfortable at 3.5%, happy at 4% and awesome anywhere above 4.5%. I find the benefit of going with a conservative plan is stress reduction during downturns.
Maxmizing log returns is very good in many respects. It has nice mathematical properties. It's not too far off from what people subjectively value. But it is an approximation. For instance, how upset would you be if you woke up to find your bank account was $0? Pretty upset I'm sure. Infinitely? Doubt it. Now some one gives you a single cent out of pity. Feeling a lot better? Hardly.
The subjective satisfaction we get from a certain amount of money is something that would take a lot of experimental science to figure out, and subject to change as society changes. How high up Maslows hierarchy of needs can you climb, and how long can you stay there until age brings you low?
Now where log returns really shine is if you make a very large number of similar bets. Thats where the asymptotic behavior dominates. But if you make a big once in a lifetime decision of whether to bet the farm on a new business idea, that's where you have to figure out your own values.
That's the thing. The Sharpe Ratio looks at a catastrophic situation and says it's ok. It's not appropriately scoring risk!
Let's say the risk-free rate of return is 3%.
Asset 1:
Every year, with 99% probability you get 8% return, and with 1% probability you get -100% return, i.e., you lose everything. This has an expected return of 7%, which is 4% above risk-free; the standard deviation is 0.1; and the Sharpe Ratio is 0.36. But the exponential of the mean log annual multiplier is zero; you will eventually lose everything.
Asset 2:
With 90% probability you get the risk-free rate of 3%, and with 10% probability, you get a 10,000% return (multiply balance by 101). Yes, this has a good average return of 1,000%, but it also has a giant standard deviation of 30, so its Sharpe Ratio is slightly worse, at 0.33. But, the exponential of the mean log multiplier is 1.62, which means that over time it will have a 62% annual return. Moreover, it literally never goes down; there's no risk.
Asset 3:
You just take the "risk free rate of return" at 3%.
Surely, the best choice is Asset 2. It's literally Asset 3 plus free lottery tickets. But it has the worst Sharpe Ratio of the three. And Asset 1, which has the flavor of some prudent tradeoff, is actually guaranteed to bankrupt you eventually.
> But maximizing log-return was proven by Kelly to be optimal, and you don't need to further penalize volatility.
This is what I'm questioning. We do need to further penalize volatility, if that is our preference.
The criteria is optimal in the sense of greatest expected return, in the limit of infinite number of bets. But we don't make infinite numbers of bets, and the variance matters.
Any truly optimal strategy has to factor in subjective preferences.
Example: We play a game where you are ill and need to pay for medical treatment. At the beginning of the game you obtain a sum of money exactly enough to pay for the treatment. Then you are allowed to place (a finite number of) bets in some gambling, possibly increasing your payoff, or losing part of it. I'd argue that in this scenario the "optimal" strategy is not playing, no matter what criteria is used to select the size of the bets.
It would make sense to allow a risk-averse utility function in our framework (say a concave function of total dollars at the end).
I don't think the identification "volatility" = "standard deviation" = "risk" matches anyone's actual preferences. So that part doesn't make sense to me.
But I like your example with the medical treatment. That could be modeled with a step utility function. Mixing it with my example, there'd be no problem choosing my Asset 2 or 3, since both guarantee that your capital will be preserved so you can pay for your treatment. If your utility function were truly a step, you'd be indifferent between Assets 2 and 3. More realistically, you'd assign minus infinity to values beneath the threshold and some monotonic function to values above (e.g. just the number of dollars), and you'd prefer Asset 2: It guarantees your medical treatment, which is what you really care about, but it throws in a free lottery ticket, so why not take that.
1. Im not sure that’s what the Kelly criterion is but I didn’t look it up.
2. Arithmetic mean of log returns is the same as the geometric mean of returns. Indeed it’s pretty typical to work with log returns for this reason as adding is easier/better for computers than multiplying. This equivalence is easy to prove:
Yeah, I should have been more clear. The point is that you can convert between them without needing any other information (like the original values that were averaged)


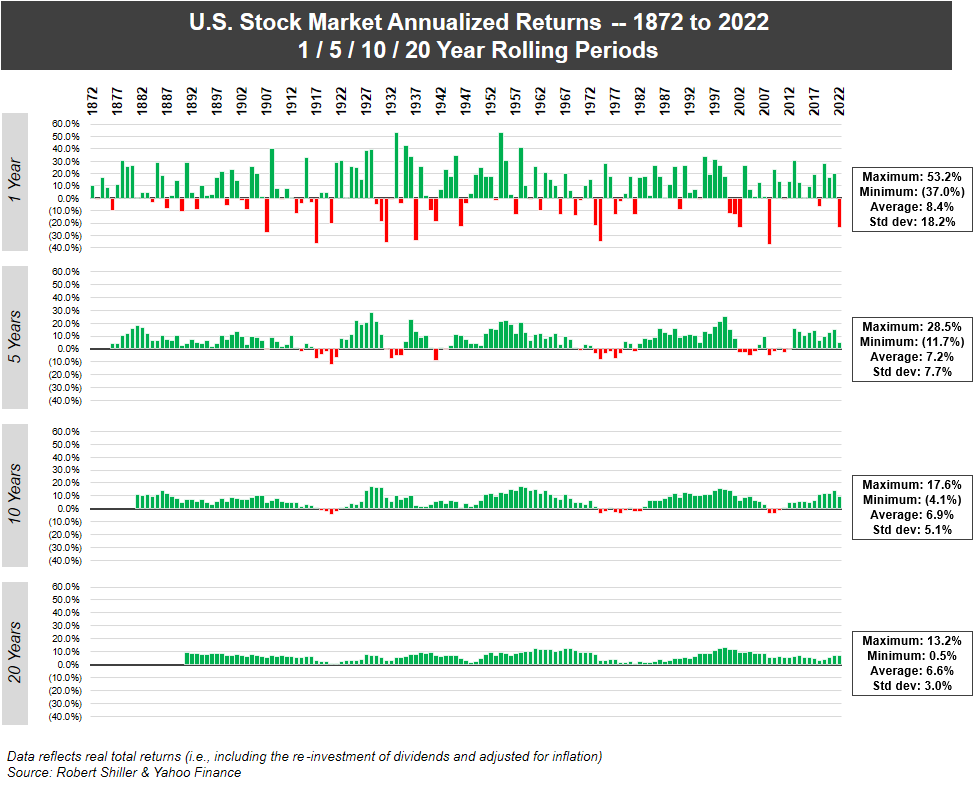
The geometric mean (6.9) is all that really matters for investors, not the arithmetic mean (8.4) - the arithmetic mean under-weights the importance of negative years to long term performance.
For example, if the market is down 20% one year and up 20% the next year, the arithmetic mean will be 0%, but you'll be down 4% (0.8*1.2 = 0.96), which is reflected in the geometric mean of (about) -2%.